How to Read Nautical Charts Like a Pro
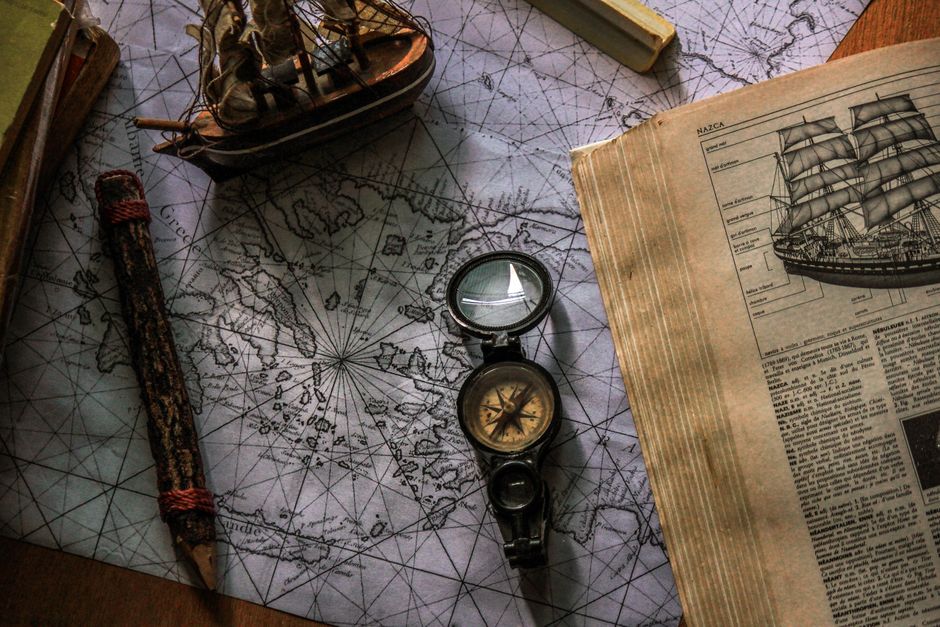
Navigating the open water requires a solid grasp of nautical charts, which serve as the primary tool for understanding the underwater landscape and safely planning a voyage. For both weekend sailors and long-distance cruisers, charts provide essential information about depths, hazards, and navigational aids. While modern electronic chartplotters have simplified navigation, the ability to interpret traditional paper charts remains a fundamental skill. This article aims to demystify the visual language of nautical charts, focusing on contour lines, symbols, and depth markings, so that you can plan your routes with confidence and precision.
At first glance, a nautical chart may appear cluttered with numbers, lines, and symbols, but each element serves a specific purpose. By learning to read these components, you not only enhance your situational awareness but also ensure a safer journey. Whether you are navigating familiar coastal waters or venturing into unknown regions, a thorough understanding of chart reading is indispensable. In the following sections, we will explore the key elements of charts, from the basics of depth soundings to the nuances of chart symbols, and conclude with practical steps for effective route planning.
Understanding Depth Contours and Soundings
Depth information is arguably the most critical data on a nautical chart, as it directly impacts your vessel’s safety. Depth soundings, which are numbers indicating the water depth at a specific point, are typically displayed in either metres or feet, depending on the chart’s unit of measurement. These soundings are usually taken at mean lower low water (MLLW), which is the average of the lowest tide levels, providing a conservative depth estimate. It is essential to note that actual depths may vary with tide, so you must always consider the tidal conditions, especially in areas with significant tidal ranges.
Contour lines, also known as depth curves, connect points of equal depth, creating a visual representation of the underwater terrain. The National Oceanic and Atmospheric Administration (NOAA) and other hydrographic offices use specific depth intervals, which are often indicated in the chart’s legend. For instance, a dashed or dotted line might represent a shallow depth, while a solid line could indicate a deeper zone. Recognising these patterns helps you identify features like underwater ridges, channels, or shoals. For example, closely spaced contours indicate a steep underwater slope, whereas widely spaced contours suggest a gentle gradient. By understanding these contours, you can plan your route to maintain a safe depth under the keel, avoiding unexpected shallows.
In addition to static depths, many charts also display spot depths, which are individual measurements that may be more reliable than interpolating between contours. When planning a route, it is wise to cross-reference both the contours and the spot depths to get a comprehensive picture. Remember that charts are updated periodically; however, natural changes such as shifting sandbars can alter depths. Therefore, consulting the latest chart editions and local notices to mariners is always recommended. With diligent interpretation of depth data, you can confidently navigate through intricate waterways, minimising the risk of grounding.
Deciphering Chart Symbols and Abbreviations
Nautical charts use a standardized set of symbols and abbreviations to convey a wealth of information compactly. These symbols represent natural and man-made features, from buoys and beacons to wrecks and underwater cables. Familiarising yourself with these symbols is akin to learning a new language, but it is a language that greatly enhances your safety at sea. The chart’s legend, usually located in a corner or on a separate sheet, provides the key to these symbols, and it is essential to study the legend for the particular chart you are using, as there can be regional variations.
One of the most common categories of symbols pertains to navigational aids, including buoys, lights, and daymarks. These aids are often depicted with specific shapes and colours, and their characteristics, such as light patterns or sound signals, are described in the chart’s abbreviations. For instance, a red buoy is typically shown as a red diamond, while a green buoy is a green square, but variations exist, so always refer to the legend. Additionally, symbols for hazards such as wrecks, rocks, and obstructions are critical to identify. A wreck that is submerged at a certain depth may be marked with a symbol and a label indicating the depth, while a rock that covers and uncovers might have a different symbol. Understanding these distinctions is vital for avoiding dangerous areas.
Another important set of symbols relates to marine services and facilities, such as anchorage areas, mooring buoys, and marinas. These are often shown with specific icons, and they are useful when planning a stop. Moreover, charts include information about tides, currents, and magnetic variation, usually presented in panels or notes. While not strictly symbols, these data are essential for accurate navigation. By carefully studying the chart’s legend and practising identification of symbols, you will gradually become fluent in reading charts, making navigation more intuitive and reducing the likelihood of misinterpretation.
Navigating with Latitudes, Longitudes, and Scales
A nautical chart is essentially a map with a coordinate system, and understanding scale is fundamental to accurate navigation. The scale of a chart indicates the ratio of a distance on the chart to the corresponding distance on the Earth’s surface. For example, a harbour chart with a scale of 1:10,000 shows greater detail, while a coastal chart might be 1:100,000. Large-scale charts are essential for entering harbours or navigating narrow channels, as they provide more precise depth soundings and better resolution of features. Conversely, small-scale charts are useful for offshore passage planning, where the focus is on broad navigation and avoiding major obstructions.
Latitude and longitude coordinates form the grid that allows you to pinpoint your position. On a chart, latitude is measured in degrees north or south of the equator, and longitude in degrees east or west of the Prime Meridian. Each degree is subdivided into minutes and seconds, and it is important to understand how to read and plot these coordinates. Many charts have a border scale in latitude and longitude, allowing you to measure distances and plot positions. To determine your position, you might use a parallel ruler to transfer your coordinates from the chart to a nautical instrument or GPS. While GPS provides precise coordinates, the ability to manually plot and cross-check on a paper chart is an invaluable backup in case of electronic failure.
Additionally, charts contain compass roses, which illustrate the difference between true north and magnetic north, a concept known as magnetic variation. This variation changes over time and location, and charts typically provide the annual change. Correcting for magnetic variation is crucial when plotting courses with a magnetic compass. The compass rose also includes a compass bearing, which you can use to measure directions with a course plotter. Understanding scale and coordinates not only helps you navigate from point A to point B but also allows you to calculate distances and estimate travel times, which are essential for trip planning and fuel management. Mastery of these fundamental aspects will transform chart reading from a daunting task into a natural part of your seafaring routine.
Integrating Chart Reading into Route Planning
With a solid foundation in depth contours, symbols, and coordinates, you are ready to apply this knowledge to practical route planning. The first step in planning a voyage is to acquire the appropriate charts for your intended area. This may involve obtaining various charts at different scales, such as a small-scale overview and a large-scale harbour chart for the destination. Before setting out, take time to study the charts thoroughly, identifying potential hazards, safe anchorages, and notable landmarks. Avoid planning a route directly over a wreck or a shallow area unless you are certain of the depths and clearances.
When plotting your course, consider the depth at various stages of the tide. Since depths on the chart are relative to MLLW, your actual depth will be greater during high tide, but you must always assume the worst-case scenario during low tide. Use contour lines to select a path that maintains a comfortable margin of depth, aiming for at least 1.5 times your vessel’s draught over the shallowest point. Additionally, take into account current and wind conditions, which can affect your speed and course over ground. A route that is ideal in calm weather may be impractical in strong winds or currents, so plan alternatives and be prepared to adapt.
It is also wise to cross-reference your chart with other sources of information, such as sailing directions (also known as pilots) and local knowledge. These resources provide valuable insights into specific hazards and recommended passages that may not be fully evident from the chart alone. Furthermore, maintaining a proper look-out and using radar or echo-sounders while underway can confirm that your chart reading is accurate and that conditions have not changed. By combining careful chart study with practical seamanship, you can plan routes that are both safe and efficient, whether you are embarking on a day sail or an extended cruise.
Maintaining Chart Awareness and Safety at Sea
Reading nautical charts is not a one-time task but an ongoing process throughout your voyage. Once underway, it is essential to keep a continuous plot of your position on the chart, updating it regularly as you make progress. This practice, known as “formal plotting” or “running fix,” ensures that you always know your location in relation to the charted features. You may use a pencil to mark your estimated position at regular intervals, and you can refine this using visual bearings to landmarks or using GPS cross-checking. This habit not only reinforces your understanding of the chart but also enhances your situational awareness, allowing you to anticipate your next move.
Regularly consulting the chart for upcoming hazards, such as crossing a shallow area or entering a narrow channel, is crucial. Use the chart to plan your track to avoid these dangers, and be ready to alter your course if conditions demand it. The use of “cleared bearings” or “cleared courses” can help you steer a safe route by staying within a corridor of safe water. For example, you might note that keeping a certain lighthouse bearing no more than 270° will keep you off a nearby shoal. Such techniques demonstrate the practical value of chart reading in real-time decision making.
Moreover, we must remember that a chart is a snapshot of conditions at the time of survey, and natural changes or new obstructions may not be depicted. Therefore, it is prudent to treat all charted information with a degree of caution, especially in areas known for shifting sands or heavy traffic. Listening to navigation warnings and checking local notices to mariners before departure can provide updates on any changes. In the end, the skill of reading nautical charts is a cornerstone of safe navigation. It empowers you to venture forth with confidence, knowing that you can interpret the marine environment accurately. For weekend sailors and long-distance cruisers alike, honing this skill will undoubtedly lead to more enjoyable and secure journeys at sea.